Introduction
The claim that flying is safer than driving is one of the most repeated statistics in public discourse. It is grounded in a specific metric: deaths per passenger mile. By that measure, commercial aviation is roughly 519 times safer than driving (USAFacts, 2026). That number is real. But it is one metric among many, and different metrics produce different conclusions. This analysis computes the comparison across six different frameworks, shows the math for each, and lets the numbers determine where each mode of transport is more or less dangerous. A Python script (calculations.py) executes every computation shown in this post.
1. The Data: Global Fleet and Fatalities (2025)
Before comparing anything, the raw inputs. These come from the IATA 2025 Safety Report, the WHO, and the Bureau of Transportation Statistics.
| Variable | Value | Source |
|---|---|---|
| Global passenger vehicles | 1,644,000,000 | OICA / industry estimates |
| Global commercial aircraft | 30,300 | IATA, 2026 |
| US general aviation aircraft | ~200,000 | FAA registry |
| Global road deaths (annual) | 1,190,000 | WHO, 2025 |
| Commercial plane deaths (2025) | 394 | IATA, 2026 |
| Commercial flights (2025) | 38,700,000 | IATA |
| Fatal commercial accidents (2025) | 8 | IATA |
| Total commercial accidents (2025) | 51 | IATA |
| US car deaths (2023) | ~43,000 | NHTSA |
| US car passenger miles (2023) | 3.2 trillion | BTS |
| US airline passenger miles (2023) | 773 billion | BTS |
The ratio of cars to planes is roughly 54,257 to 1.
2. Metric 1: Deaths per Passenger Mile
This is the standard metric. It measures how many people die for every 100 million passenger miles traveled.
Calculation (US 2023):
- Cars: 43,000 / 3,200,000,000,000 x 100,000,000 = 1.34 deaths per 100M miles
- Planes: 20 / 773,000,000,000 x 100,000,000 = 0.0026 deaths per 100M miles
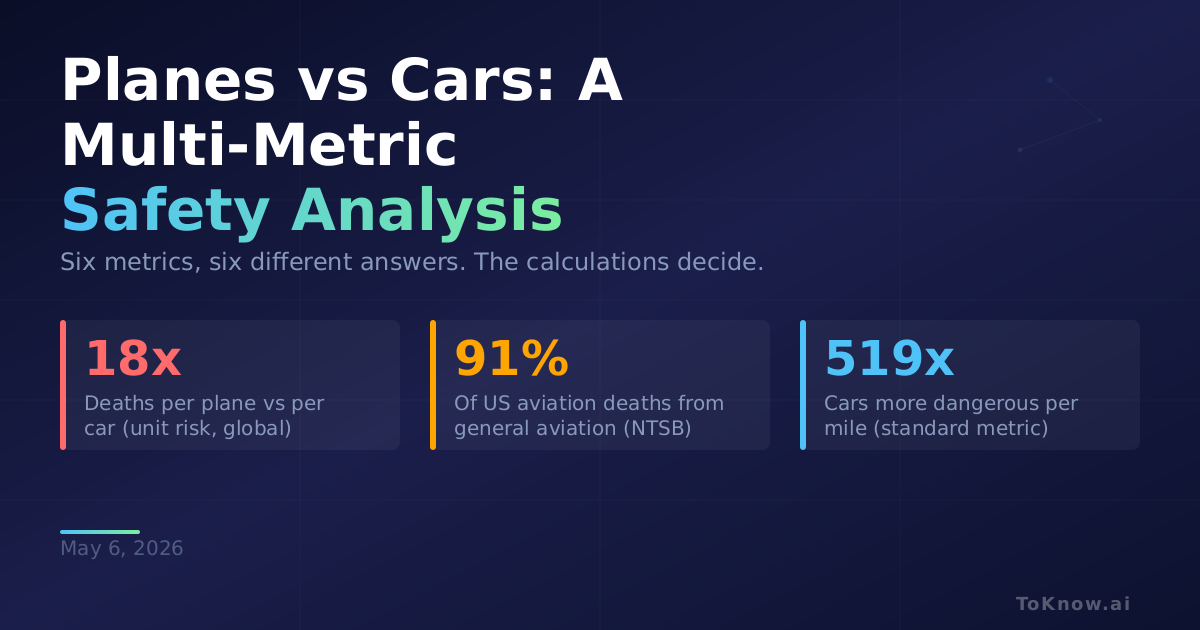
- Ratio: 1.34 / 0.0026 = 519x
Result: Per mile traveled, cars are 519 times more dangerous than commercial planes. This is the metric cited in nearly all aviation safety communications.
Structural note: A plane cruising at 525 mph covers roughly 11.7 times more distance per hour than a car averaging 45 mph. If both modes produced identical fatality rates per hour of exposure, the faster vehicle would still appear 11.7x safer in a per-mile chart because each death is diluted across more miles. This does not make the metric invalid. But it does mean per-mile comparisons structurally favor faster vehicles.
3. Metric 2: Deaths per Vehicle per Year (Unit Risk)
This metric asks: for any single vehicle in the global fleet, how many deaths is it associated with annually?
Calculation (Global 2025):
- Cars: 1,190,000 deaths / 1,644,000,000 vehicles = 0.000724 deaths per car per year
- Commercial planes: 394 deaths / 30,300 aircraft = 0.013003 deaths per plane per year
- Ratio: 0.013 / 0.000724 = 18.0x
Result: A single commercial aircraft is associated with 18 times more deaths per year than a single car.
The reason is structural. A commercial plane operates 12 to 16 hours per day, carries 100 to 400 passengers per flight, and covers 5,000+ miles daily. A car sits parked roughly 95% of the time and carries 1 to 2 people on average. The plane is a far more intensively used machine. When a failure occurs, the number of people exposed to it is orders of magnitude higher.
4. Metric 3: Deaths per Hour of Exposure
This metric normalizes for the speed difference by measuring risk per hour spent in the vehicle rather than per mile traveled.
Rates (from NTSB, IATA, NHTSA-derived data):
- Cars: 0.33 deaths per million hours of exposure
- Commercial planes: 0.037 deaths per million hours
- General aviation: 9.5 fatal accidents per million flight hours
Results:
- Per hour, cars are 9x more dangerous than commercial planes
- Per hour, general aviation is 29x more dangerous than cars
The per-hour comparison narrows the gap between cars and commercial planes from 519x (per mile) to 9x. For general aviation, the relationship inverts entirely.
5. Metric 4: Accident Severity and Survival
This metric examines what happens when an accident occurs, regardless of how often accidents happen.
Cars (US annual):
- Total accidents: ~6,000,000
- Deaths: ~43,000
- Fatality rate per accident: 43,000 / 6,000,000 = 0.72%
- Survival rate: 99.28%
Commercial planes (global 2025):
- Total accidents: 51
- Fatal accidents: 8
- Percentage of accidents that are fatal: 8 / 51 = 15.7%
- Average deaths per fatal accident: 394 / 8 = 49.2
Result: When a car accident occurs, there is a 0.72% chance someone dies. When a plane accident occurs, there is a 15.7% chance it involves fatalities. The per-event lethality is 22x higher for planes.
This is a structural difference. A car collides at 30 to 70 mph with crumple zones and airbags. A plane at cruise altitude carries hundreds of people and enormous kinetic energy. The overall aviation survival rate across all incident types is 90% to 95%, but that includes non-catastrophic events like runway excursions and hard landings. In the catastrophic subset (mid-air structural failure, controlled flight into terrain), survival rates approach zero. In 2025, two specific accidents (Air India 171 and PSA 5342) accounted for over 77% of all global aviation fatalities (IATA, 2026).
6. The Aviation Fatality Breakdown: General Aviation vs Airlines
“Aviation” is not a single category. NTSB data from 2013 (the most recent full annual review available) breaks US civil aviation into regulatory segments:
| Segment | Accidents | Fatal Accidents | Deaths | % of Total Deaths |
|---|---|---|---|---|
| Part 121 (Airlines) | 23 | 2 | 9 | 2.1% |
| Part 135 (Commuter/On-demand) | 51 | 12 | 30 | 7.0% |
| General Aviation | 1,224 | 222 | 390 | 90.9% |
| Total | 1,298 | 236 | 429 | 100% |
Source: NTSB, 2015
91% of US aviation deaths come from general aviation. USAFacts reports a similar pattern across 2003 to 2023: 77% of the 787 total US air travel deaths in that period occurred on smaller aircraft, not scheduled commercial flights (USAFacts, 2026).
General aviation includes private propeller planes, air taxis, charter flights, and flight training. These aircraft operate under less stringent regulations (Part 91/135 vs Part 121), are flown by pilots with fewer training hours, and lack the redundant safety systems of commercial airliners. When safety statistics cite “aviation,” the commercial subset produces the per-mile figures while the general aviation subset produces the majority of fatalities.
7. The Population Exposure Question
A distinct argument concerns the composition of the groups at risk. The global population exposed to road risk is nearly universal, roughly 6.8 billion people (85% of the world). The population that flies commercially is a concentrated subset of approximately 1.2 billion unique people per year (IATA), roughly 15% of humanity.
Deaths per unique participant per year:
- Cars: 1,190,000 / 6,800,000,000 = 0.000175
- Planes: 394 / 1,200,000,000 = 0.00000033
- Ratio: 533x (cars more dangerous per participant)
By this measure, cars are overwhelmingly more dangerous per person in the exposed group. However, several structural factors merit consideration:
Exposure time disparity: Americans spend roughly 700 hours per year in cars and about 20 hours per year flying. The exposure time difference is 35x. The NSC’s lifetime odds data reflects this: motor vehicle death odds are 1 in 101, while airplane passenger death odds are listed as “too few deaths in 2024 to calculate” (NSC, 2026). This is substantially a function of exposure volume.
Group composition: The flying population skews wealthier, healthier, and more urban. The road-exposed population includes pedestrians, cyclists, motorcyclists, and passengers in developing countries with minimal safety infrastructure. Comparing the two groups involves confounding variables beyond the vehicle itself.
Agency: A car occupant has some control over outcomes (seatbelt usage, speed, sobriety). A plane passenger has zero control. This distinction does not change the statistics, but it changes the nature of the risk: driving is a partially controllable hazard, while flying is an entirely delegated one.
8. Conclusion
The question “are planes safer than cars?” does not produce a single answer. It produces several, depending on the unit of measurement.
| Metric | Safer Mode | Factor |
|---|---|---|
| Deaths per billion passenger miles | Plane | ~519x |
| Deaths per million hours (commercial) | Plane | ~9x |
| Deaths per unique participant | Plane | ~533x |
| Deaths per vehicle per year | Car | ~18x |
| Deaths per million hours (general aviation) | Car | ~29x |
| % of accidents that are fatal | Car (lower %) | 0.7% vs 15.7% |
Key observations:
- Commercial aviation is safer than driving by per-mile, per-hour, and per-participant measures
- General aviation (private planes, charters, air taxis) is 29 times more dangerous than driving per hour of exposure
- 91% of US aviation fatalities come from general aviation, not the airlines referenced in per-mile safety statistics
- The per-mile metric structurally favors faster vehicles by a factor proportional to the speed difference (~12x)
- Per vehicle, a single commercial plane is associated with 18x more deaths per year than a single car, a consequence of intensive usage and high passenger counts
- When a plane accident occurs, the per-event fatality rate is 22x higher than a car accident
- The flying population (1.2 billion unique people) is a concentrated subset of the general population, while road exposure is near-universal
No single metric captures the full picture. A rigorous understanding of transportation safety requires examining multiple metrics simultaneously.
References
- USAFacts. (2026). Is flying safer than driving? USAFacts analysis of Bureau of Transportation Statistics data.
- Bureau of Transportation Statistics. (2024). National Transportation Statistics. US Department of Transportation.
- NTSB. (2015). Summary of US Civil Aviation Accidents for Calendar Year 2013. National Transportation Safety Board.
- National Safety Council. (2026). Odds of Dying. Injury Facts.
- NHTSA. (2024). Traffic Safety Facts. National Highway Traffic Safety Administration.
- World Health Organization. (2025). Road Traffic Injuries. WHO Fact Sheet.
- IATA. (2026). IATA Releases 2025 Safety Report. International Air Transport Association.
- Airbus. (2026). Flight Safety Statistics and Accident Trends 2025. Airbus Newsroom.
- Federal Aviation Administration. (2025). General Aviation Safety. FAA Data and Research.
- ICAO. (2025). State of Global Aviation Safety. International Civil Aviation Organization.
Disclaimer: For information only. Accuracy or completeness not guaranteed. Illegal use prohibited. Not professional advice or solicitation. Read more: /terms-of-service
Reuse
Citation
@misc{kabui2026,
  author = {{Kabui, Charles}},
  title = {Planes Vs {Cars:} {A} {Multi-Metric} {Safety} {Analysis}},
  date = {2026-05-06},
  url = {https://toknow.ai/posts/planes-vs-cars-multi-metric-safety-analysis/},
  langid = {en-GB}
}