import pandas as pd
import matplotlib.pyplot as plt
from matplotlib import animation
import requests
from IPython.display import HTMLImports
Data and plot
The data has been sourced from the World Bank API.1
# Fetch population data for Kenya from the World Bank API
url = 'http://api.worldbank.org/v2/countries/KEN/indicators/SP.POP.TOTL?format=json'

# Send a GET request to the World Bank API
json = requests.get(url).json()[1]

# Extract the JSON data, rename and sort
data = pd.DataFrame(json, columns=['date', 'value'])\
    .rename(columns={'date': 'Year', 'value': 'Population'})\
    .sort_values(by='Year', ascending=True)\
    .reset_index(drop=True)
data| Year | Population | |
|---|---|---|
| 0 | 1974 | 13203949.0 |
| 1 | 1975 | 13651908.0 |
| 2 | 1976 | 14102268.0 |
| 3 | 1977 | 14577346.0 |
| 4 | 1978 | 15087423.0 |
| 5 | 1979 | 15620613.0 |
| 6 | 1980 | 16187124.0 |
| 7 | 1981 | 16785962.0 |
| 8 | 1982 | 17411491.0 |
| 9 | 1983 | 18069461.0 |
| 10 | 1984 | 18753176.0 |
| 11 | 1985 | 19452161.0 |
| 12 | 1986 | 20160879.0 |
| 13 | 1987 | 20882094.0 |
| 14 | 1988 | 21626122.0 |
| 15 | 1989 | 22387803.0 |
| 16 | 1990 | 23162269.0 |
| 17 | 1991 | 23918235.0 |
| 18 | 1992 | 24655723.0 |
| 19 | 1993 | 25391830.0 |
| 20 | 1994 | 26133744.0 |
| 21 | 1995 | 26878347.0 |
| 22 | 1996 | 27615736.0 |
| 23 | 1997 | 28364264.0 |
| 24 | 1998 | 29137373.0 |
| 25 | 1999 | 29965129.0 |
| 26 | 2000 | 30851606.0 |
| 27 | 2001 | 31800343.0 |
| 28 | 2002 | 32779823.0 |
| 29 | 2003 | 33767122.0 |
| 30 | 2004 | 34791836.0 |
| 31 | 2005 | 35843010.0 |
| 32 | 2006 | 36925253.0 |
| 33 | 2007 | 38036793.0 |
| 34 | 2008 | 39186895.0 |
| 35 | 2009 | 40364444.0 |
| 36 | 2010 | 41517895.0 |
| 37 | 2011 | 42635144.0 |
| 38 | 2012 | 43725806.0 |
| 39 | 2013 | 44792368.0 |
| 40 | 2014 | 45831863.0 |
| 41 | 2015 | 46851488.0 |
| 42 | 2016 | 47894670.0 |
| 43 | 2017 | 48948137.0 |
| 44 | 2018 | 49953304.0 |
| 45 | 2019 | 50951450.0 |
| 46 | 2020 | 51985780.0 |
| 47 | 2021 | 53005614.0 |
| 48 | 2022 | 54027487.0 |
| 49 | 2023 | NaN |
data.dropna(inplace=True)
data['Year'] = data['Year'].astype(int)

populations = data['Population'] / 10**6  # Convert population to millions
years = data['Year']

# Set up the figure and axis
fig, ax = plt.subplots(figsize=(10, 8))
ax.set_xlabel('Year')
ax.set_ylabel('Population (Million)')
ax.grid(True, which='both', linestyle='--', linewidth=0.5)  # Add grid lines

# Create a line object
line, = ax.plot([], [], lw=3, color='blue')

# Function to update the animation frame
def animate(i):
    year = data['Year'].min() + i
    line.set_data(years[:i+1], populations[:i+1])

    ax.set_xlim(years.min(), years.max())
    ax.set_ylim(0, populations.max() * 1.1)
    ax.set_title(f'Kenya Population ({year} - {populations[i]:.2f}M)')

    return line,

# Create the animation
ani = animation.FuncAnimation(fig, animate, frames=len(data), interval=300, blit=True, repeat=False)
fig.suptitle(f"Kenyan Population, Year {data.loc[0, 'Year']} to Year {int(data.iloc[-1]['Year'])}")

# Add a watermark to the center of the plot
ax.text(0.95, 0.02, 'ToKnow.ai', ha='right', va='bottom',
        fontsize=18, color='gray', alpha=0.5, transform=ax.transAxes, rotation=45)

# Display the animation
plt.close(ani._fig)
Video
# ani.save('./index.mp4',  dpi=600)

HTML(f'<div class="ratio ratio-16x9">{ani.to_html5_video()}</div>')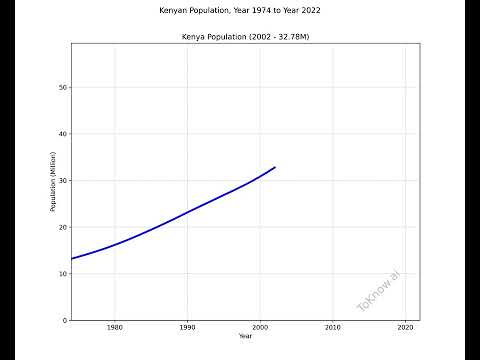
Disclaimer: For information only. Accuracy or completeness not guaranteed. Illegal use prohibited. Not professional advice or solicitation. Read more: /terms-of-service
Footnotes / Citations / References
Reuse
GNU GENERAL PUBLIC LICENSE v3.0(View License)
Citation
BibTeX citation:
@misc{kabui2024,
  author = {{Kabui, Charles}},
  title = {Kenya {Population} from Year 1974 to Year 2022},
  date = {2024-06-08},
  url = {https://toknow.ai/posts/kenya-population-from-1974-to-2022/index.html},
  langid = {en-GB}
}
For attribution, please cite this work as:
Kabui, Charles. 2024. “Kenya Population from Year 1974 to Year
2022.” https://toknow.ai/posts/kenya-population-from-1974-to-2022/index.html.