Graph theory is the study of networks of connected objects. A graph consists of nodes (vertices) and edges (connections). If edges have a direction, it’s a directed graph (digraph); otherwise, it’s undirected.
Why is Graph Theory Important?
Navigation & Routing - Used in GPS systems, internet routing, and traffic optimization.
Social Networks - Helps analyze connections and influence, like in Facebook or Twitter.
Data Relationships - Useful in databases, recommendation systems (Netflix, Amazon), and web linking (Google’s PageRank).
Biology & Chemistry - Helps model DNA structures, chemical compounds, and disease spread.
Artificial Intelligence - Used in neural networks, decision trees, and search algorithms.
Project Management - Critical path analysis in workflows and task dependencies.
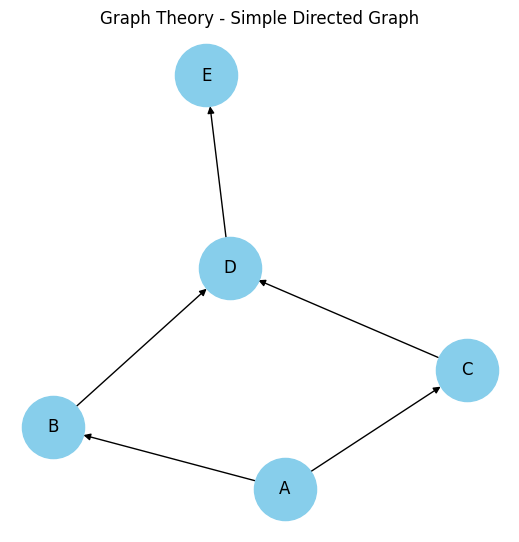
import networkx as nximport matplotlib.pyplot as plt# Create a directed graphG = nx.DiGraph()# Add edges (connections)edges = [ ("A", "B"), ("A", "C"), ("B", "D"), ("C", "D"), ("D", "E")]G.add_edges_from(edges)# Draw the graphplt.figure(figsize=(5, 5))nx.draw( G, with_labels=True, node_color="skyblue", edge_color="black", arrows=True, node_size=2000, font_size=12)plt.title("Graph Theory - Simple Directed Graph")plt.show()
Applications
Question 1: Shortest Path in a Road Network (Dijkstra’s Algorithm)
A logistics company called Home Logistics wants to determine the most efficient route between two cities in a given road network. The network is represented as a graph where cities are nodes and roads are edges with weights corresponding to the travel distance (in kilometers).
Given the following graph representation of a road network, write a Python program using Dijkstra’s Algorithm to find the shortest path from City A to City F.
Shortest Path: ['A', 'C', 'D', 'F']
Total Distance: 7 km
Question 2: Influence Analysis in a Social Network (PageRank Algorithm)
A social media platform wants to identify the most influential users based on follower relationships. The network is represented as a directed graph, where each user is a node, and an edge from user A to user B means that A follows B. Given the following directed graph of follower relationships, implement a Python program using the PageRank algorithm to rank users by influence.
Question 3: Maximum Flow in a Water Distribution System (Ford-Fulkerson Algorithm)
A city’s water supply system consists of reservoirs, pipelines, and distribution points. The system is represented as a directed graph, where nodes represent junctions (reservoirs or city areas) and edges represent water pipelines with capacity limits. Given the following network, where the source is S (reservoir) and the sink is T (city distribution center), use the Ford-Fulkerson algorithm to determine the maximum amount of water that can be transported to the city.
Disclaimer:For information only. Accuracy or completeness not guaranteed. Illegal use prohibited. Not professional advice or solicitation.Read more: /terms-of-service